Welcome – Panagiotis Spentzouris
Panagiotis Spentzouris welcomed participants and said the emphasis for LArSoft is on moving forward, improving technologies. Looking at the agenda, that’s what LArSoft is doing. As Panagiotis said, “Improvements in performance have been accomplished … Looking at the path of this project, things are on track.” Panagiotis’ welcome is available as an audio file below.
Introduction and welcome – Erica Snider
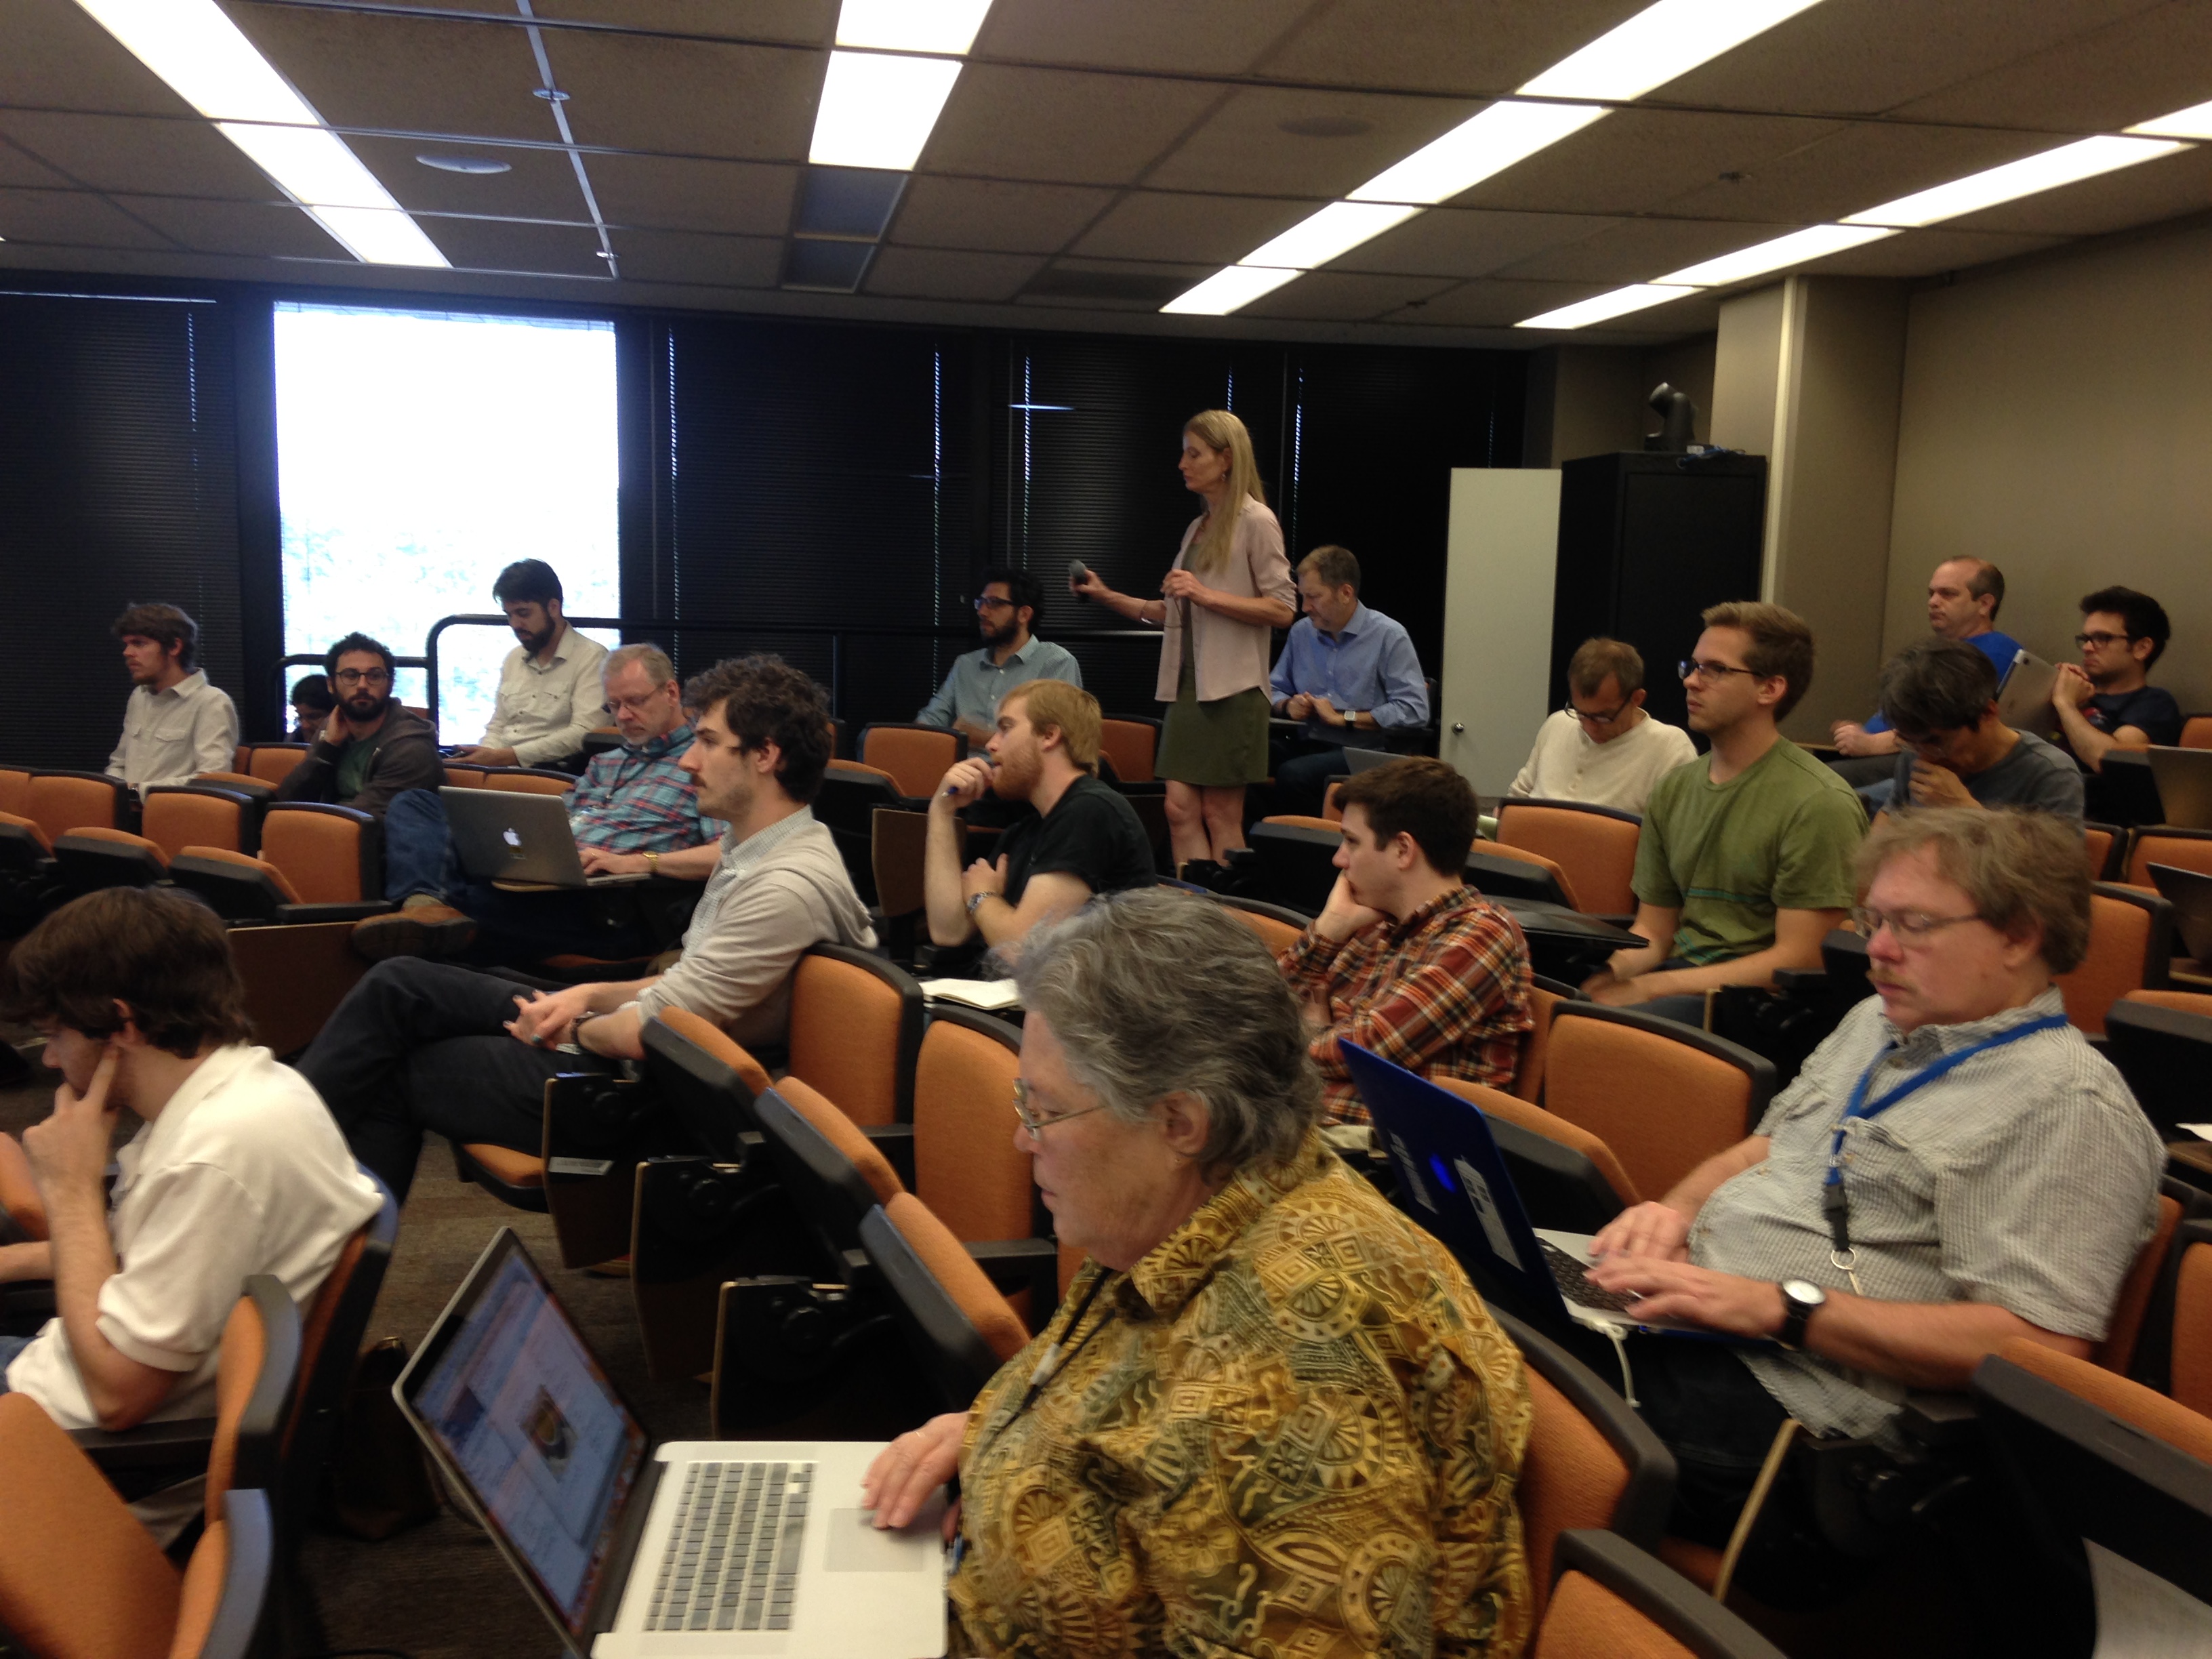
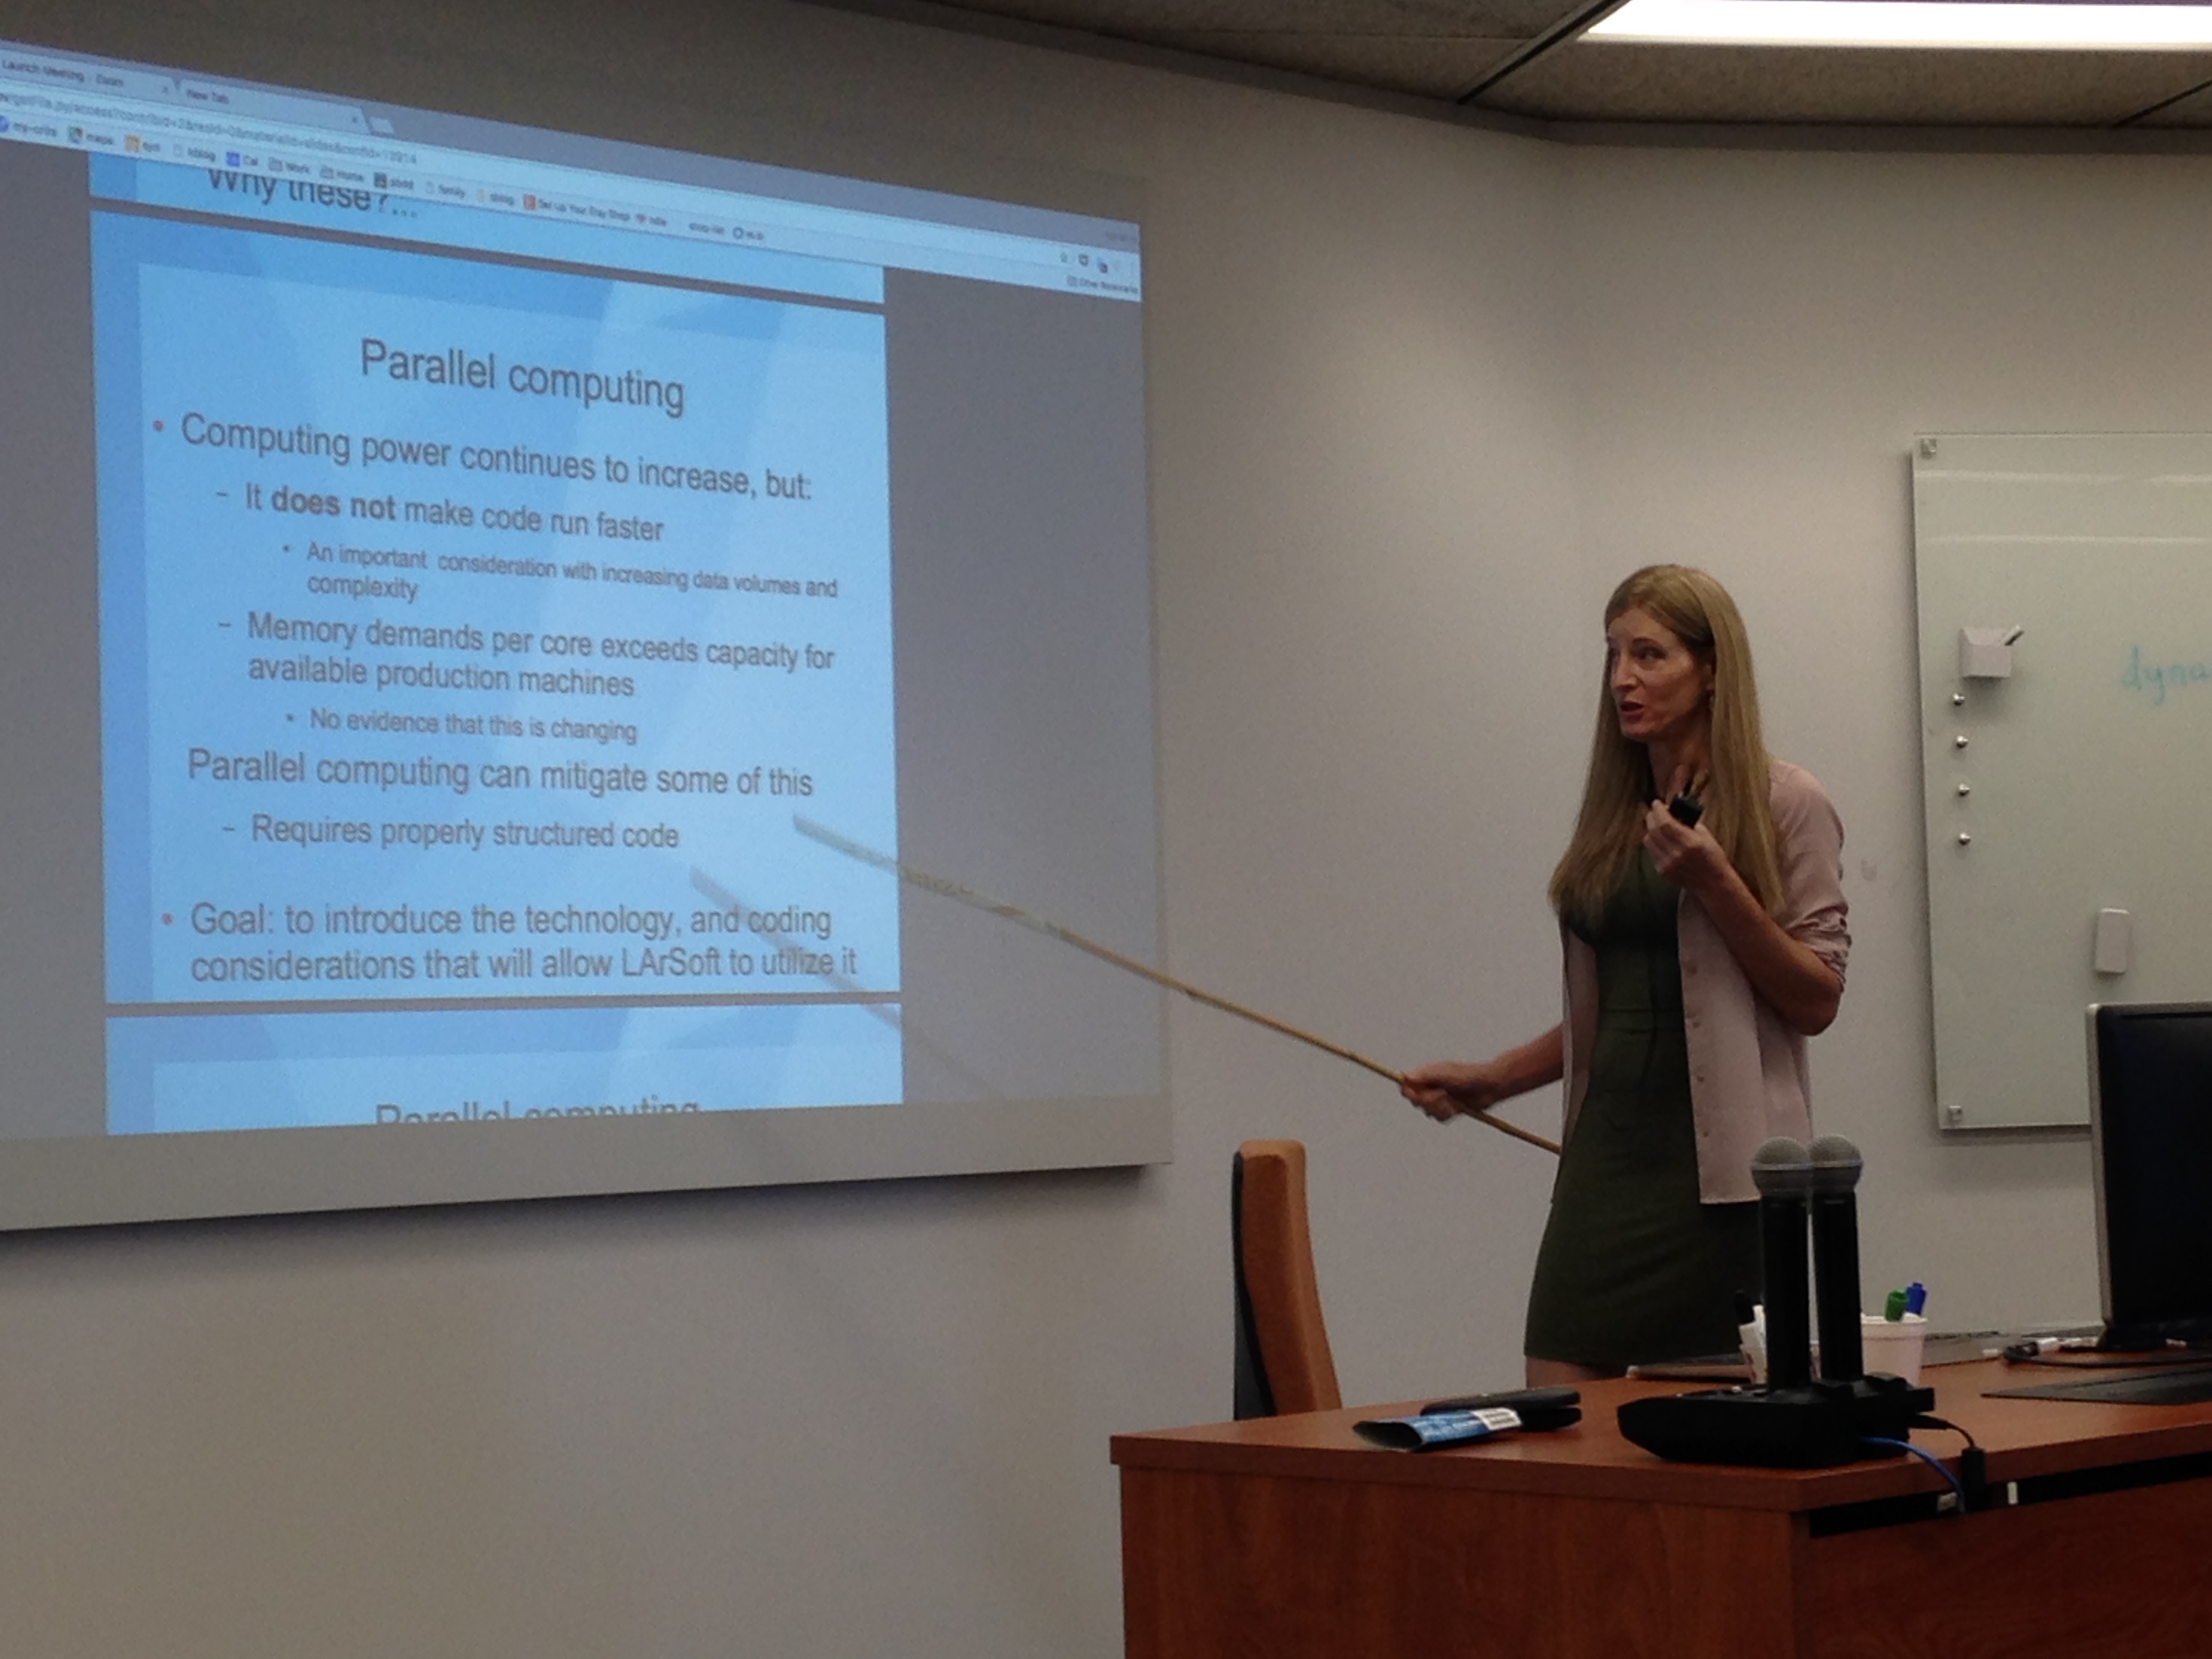 Erica provided an introduction to the workshop, explaining that the reason for the workshop is that, “We want things that make our work easier, that help us produce better code and make our code run faster/more efficiently.” The workshop explores parallel computing, Continuous Integration, a new build system for art/LArSoft called Spack, debugging and profiling tools. Erica’s presentation is available as slides or as a video.
Introduction to multi-threading – Chris Jones
 Chris explained that multi-threading is threads that can interact through shared memory, whereas multiple processes cannot. Multi-threading speeds up the program and enables the sharing of resources within the program itself. This is needed because computing hardware trends are that CPU frequencies no longer increase. Included in the presentation were examples of race conditions and that there are no benign race conditions. There are different levels of thread safety for objects:
- thread hostile – not safe for more than one thread to call methods even for different class instances
- thread friendly – different class instances can be used by different threads safely
- const-thread safe – multiple threads can call const methods on the same class instance
- thread safe – multiple threads can call non-const methods on the same class instance
Chris included things to get ready for multi-threading. This included removing ‘global’ variables, not using mutable member data for event data products and removing mutable state from services. A useful talk about C++ threading memory model is available at: https://channel9.msdn.com/Shows/Going+Deep/Cpp-and-Beyond-2012-Herb-Sutteratomic-Weapons-1-of-2
Chris’s presentation is available as slides or a video.
Vectorization and LArSoft – James Amundson

Single Instruction Multiple Data (SIMD) – a single instruction performs the same operation on multiple data items. We used to be able to just wait for hardware improvements to get faster, but that isn’t true anymore, as the following shows.
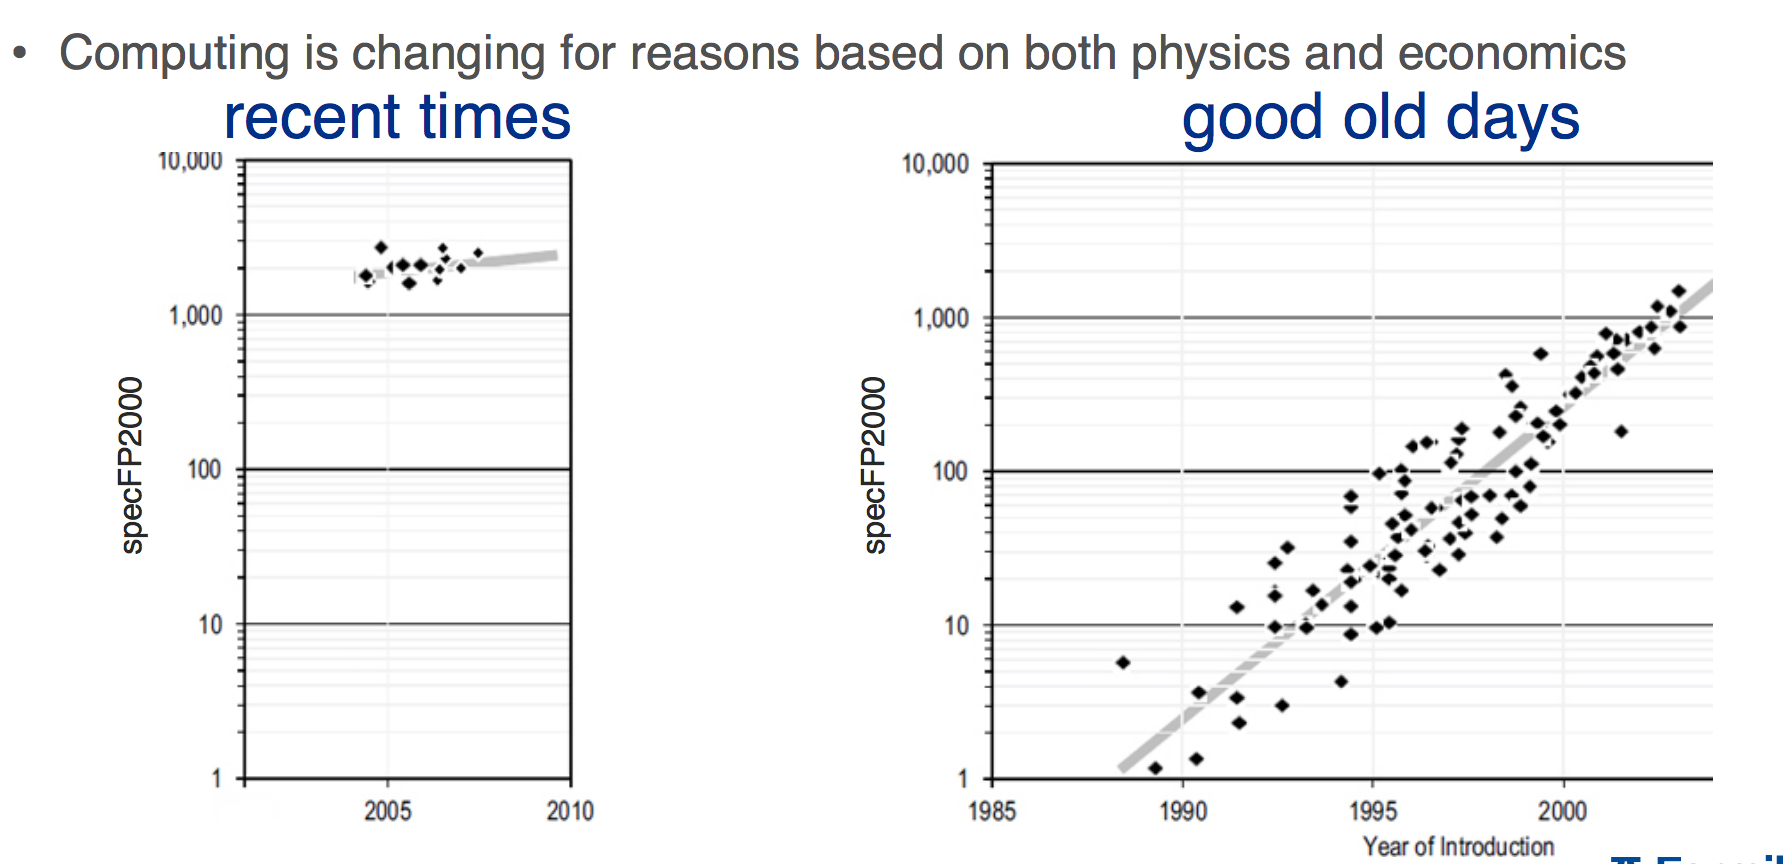
SIMD instructions have the potential to improve floating point performance two to 16 times. Jim showed examples of taking advantage of SIMD instructions, encouraging people to look at the different libraries that do this. Many widely-available math libraries include SIMD intrinsic support. He showed a LArSoft roofline analysis performed by Giuseppe Cerati using Intel Advisor.
Jim’s presentation is available as slides or a video.
LArSoft CI System Overview – Vito Di Benedetto
 Continuous Integration is a software engineering practice in which changes in a software code are immediately tested and reported. The goal is to provide rapid feedback to help identify defects introduced by code changes as soon as possible. Vito covered how to run CI and obtain results with detailed examples. The questions included wanting to see a sample script, so Vito brought up the Redmine page: https://cdcvs.fnal.gov/redmine/projects/lar_ci/wiki.
Vito’s pesentation is available as slides or a video.
Spack and SpackDev build system -James Amundson
LArsoft and art are moving to the Spack and SpackDev based build system. This system does not have one-for-one replacements for existing tools. Spack is a package manager designed to handle multiple versions and variants – https://spack.io/ – https://github.com/LLNL/spack. The original plan was to have a full demo at this workshop, but Spack development is behind schedule, so we could only explore Spack functionality. To try Spack, go to https://github.com/amundson/spackdev-bootstrap
Jim’s presentation is available as slides or a video.
Debugging tools – Paul Russo
 Paul explained the basics of using the gdb debugger to find and fix errors in code. The compiler must help the debugger by writing a detailed description of their code to the object file during compilation. This detailed description is commonly referred to as debugging symbols.
Paul’s presentation is available as slides or a video.
Profiling Tutorial – Soon Yung Jun
 Soon Yung gave an introduction to computing performance profiling with an overview of selected profiling tools and examples. Performance tuning is an essential part of the development cycle. Performance benchmarking quantifies usage/changes of CPU time and memory (amount required or churn). Performance profiling analyzes hot spots, bottlenecks and efficient utilization of resources. Soon also gave profiling results of the LArTest application with IgProf and Open|Speedshop.
Soon’s presentation is available as slides or a video.
Feedback
Comments include:
- I found most of it useful. I’m fairly new to all of this, so it was mostly all new, useful information.
- Increasing the portions for beginners or have a stand alone workshop for beginners.
- More hands-on, interactive tutorials for the audience, even if it means installing some software/programs in advance.
- I would like to have some topics which may be aimed towards participants who are less-than experts with the hope that us physicists can be more than just second-rate programmers.
- Mostly; I thought the topics were good choices but would have preferred it to be a bit more hands-on.
- I think these topics were the right ones; maybe even more on running on HPC resources next time.
Thanks to all who presented and/or participated.